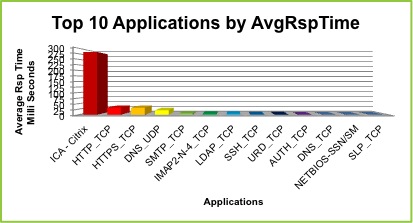
The following graph represents the Top 10 Applications by Average Response Time with Citrix being the slowest to respond.
|
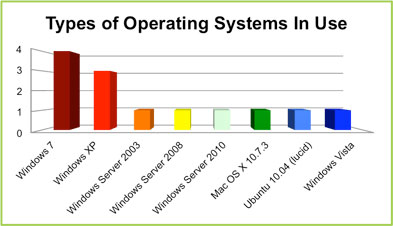
The following graph represents the different types of operating systems being used.
|
||||||||||||||||||||||||||
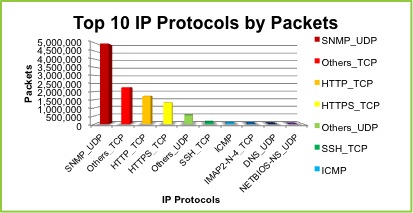
The following graph represents the Top 10 Protocols by Packets with SNMP being the Top Protocol by Packets.
|
Click HERE to see an example of the math on how KeenRevolutions determines the estimated total capacity of the backbone traffic. |